6 Information-based designs
Information-based designs allow sample size adaptation at interim analyses based on the variability of the treatment effect estimate. This is generally done blinded to treatment group.
6.1 Overview and input
6.1.1 Overview
Statistical information for a parameter is equal to one over the variance of the estimator for that parameter. Since the variance for a parameter normally takes the form \(\psi / n\) where \(n\) is most often sample size (e.g., binomial or normal endpoints) or number of events (time-to-event designs), you can see that statistical information increases proportionately to \(n\). Information is a continuous outcome, so we do not restrict ourselves to integer information as we have by default restricted to integer sample size and event counts in previous chapters; integer sizing is turned off for information-based design. If the parameter \(\psi\) is not known, it can be estimated and the statistical information can be estimated; we will denote the statistical information by \(I\) here. This chapter explains how to design a trial based on using statistical information instead of sample size or number of events as your index for how far you have proceeded in a trial.
6.1.2 Input
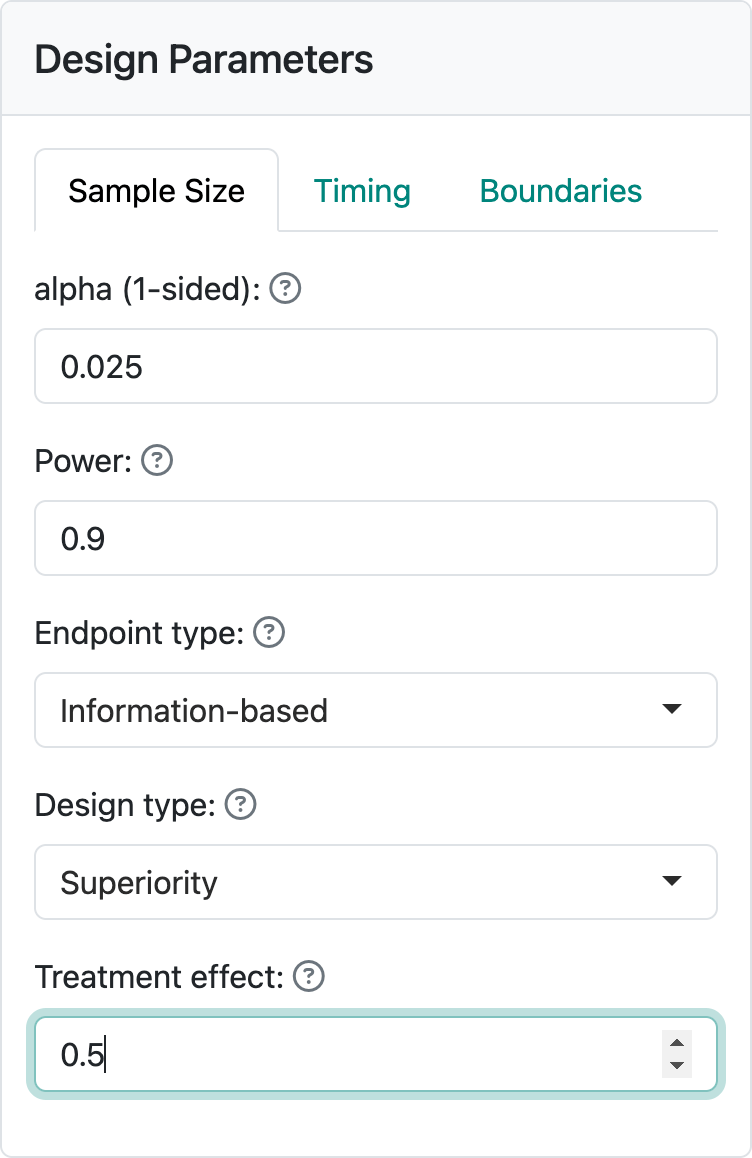
The input for information-based designs is quite simple as we see in Figure 6.1: you only need to input the target treatment effect you wish to power the trial for. This design has been saved in info.rds.
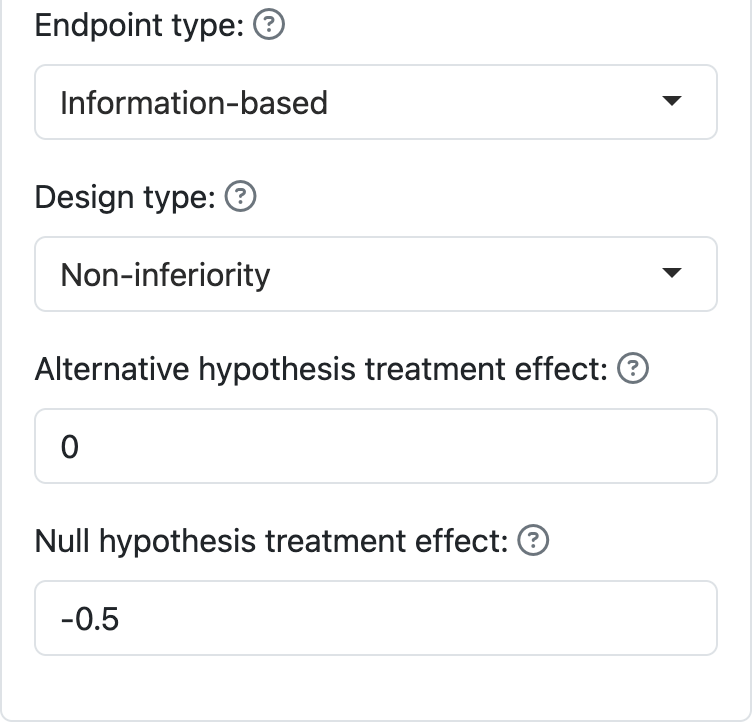
For non-inferiority, you have to specify a treatment effect under both the null and alternate hypothesis, as seen in Figure 6.2.
Information-based design puts more burden on the user to compute statistical information at an interim analysis. The advantage is that it gives a better sample size when the nuisance parameter \(\psi\) related to the variance of the parameter estimate is unknown. We provide more information on information-based designs in Chapter 9 where we discuss R coding and go through a couple of examples in some detail.
6.2 Output
6.2.1 Plots
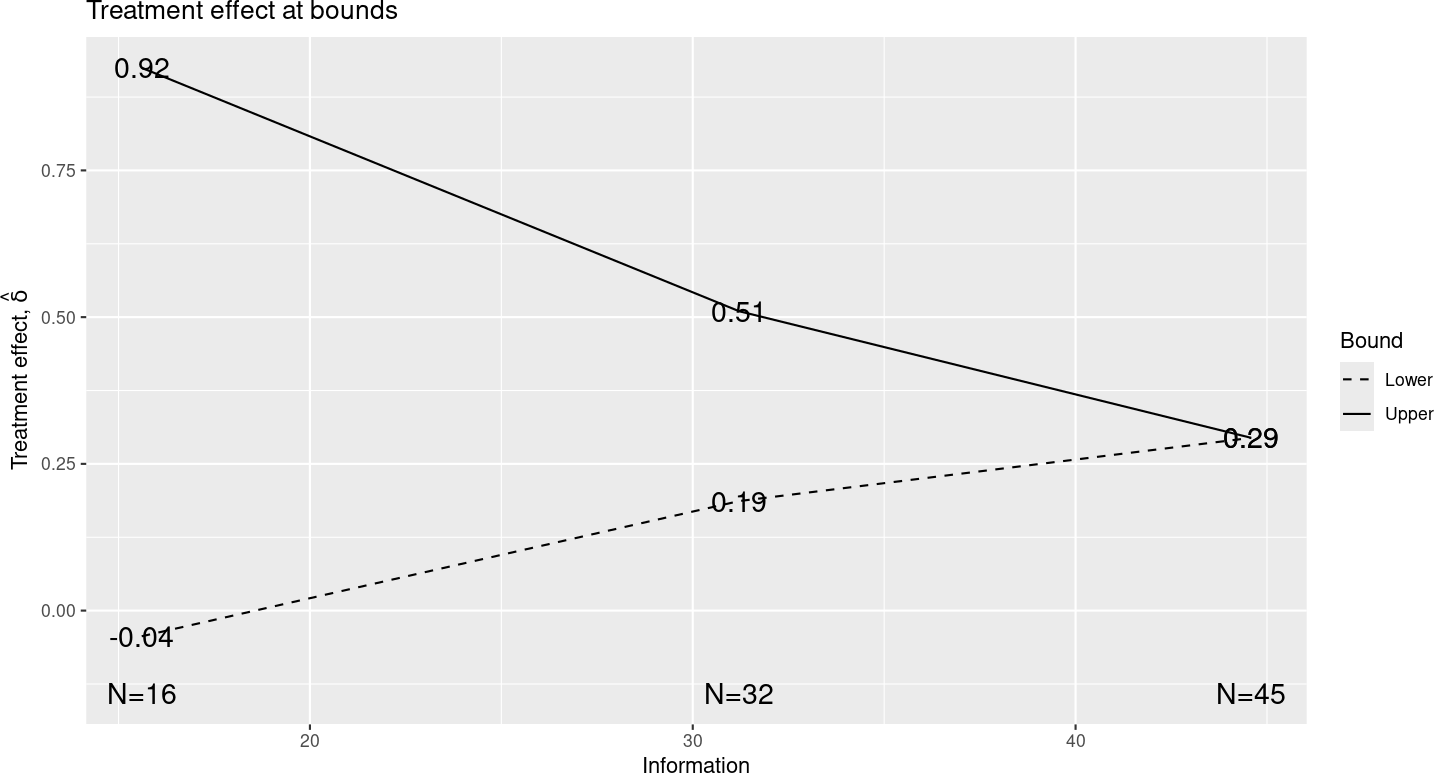
We will show two plots to demonstrate how output varies when using information-based design. The treatment effect plot (Figure 6.3) now has “Information” on the x-axis, as do all other plots that would have “Sample size” or “Number of events” on the x-axis for other designs.
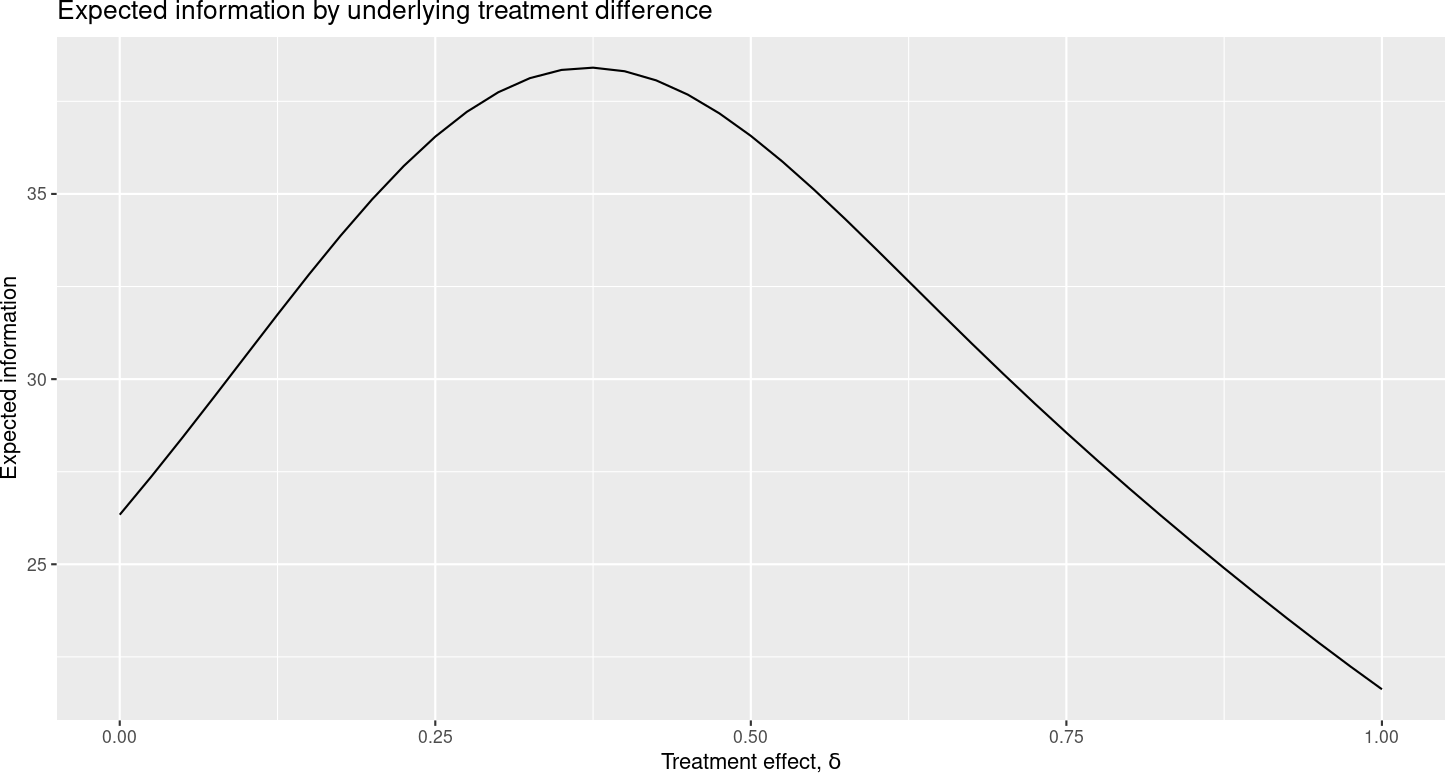
Similarly, the “Expected sample size” plot (Figure 6.4) has “Expected information” on the y-axis.
6.2.2 Tabular output
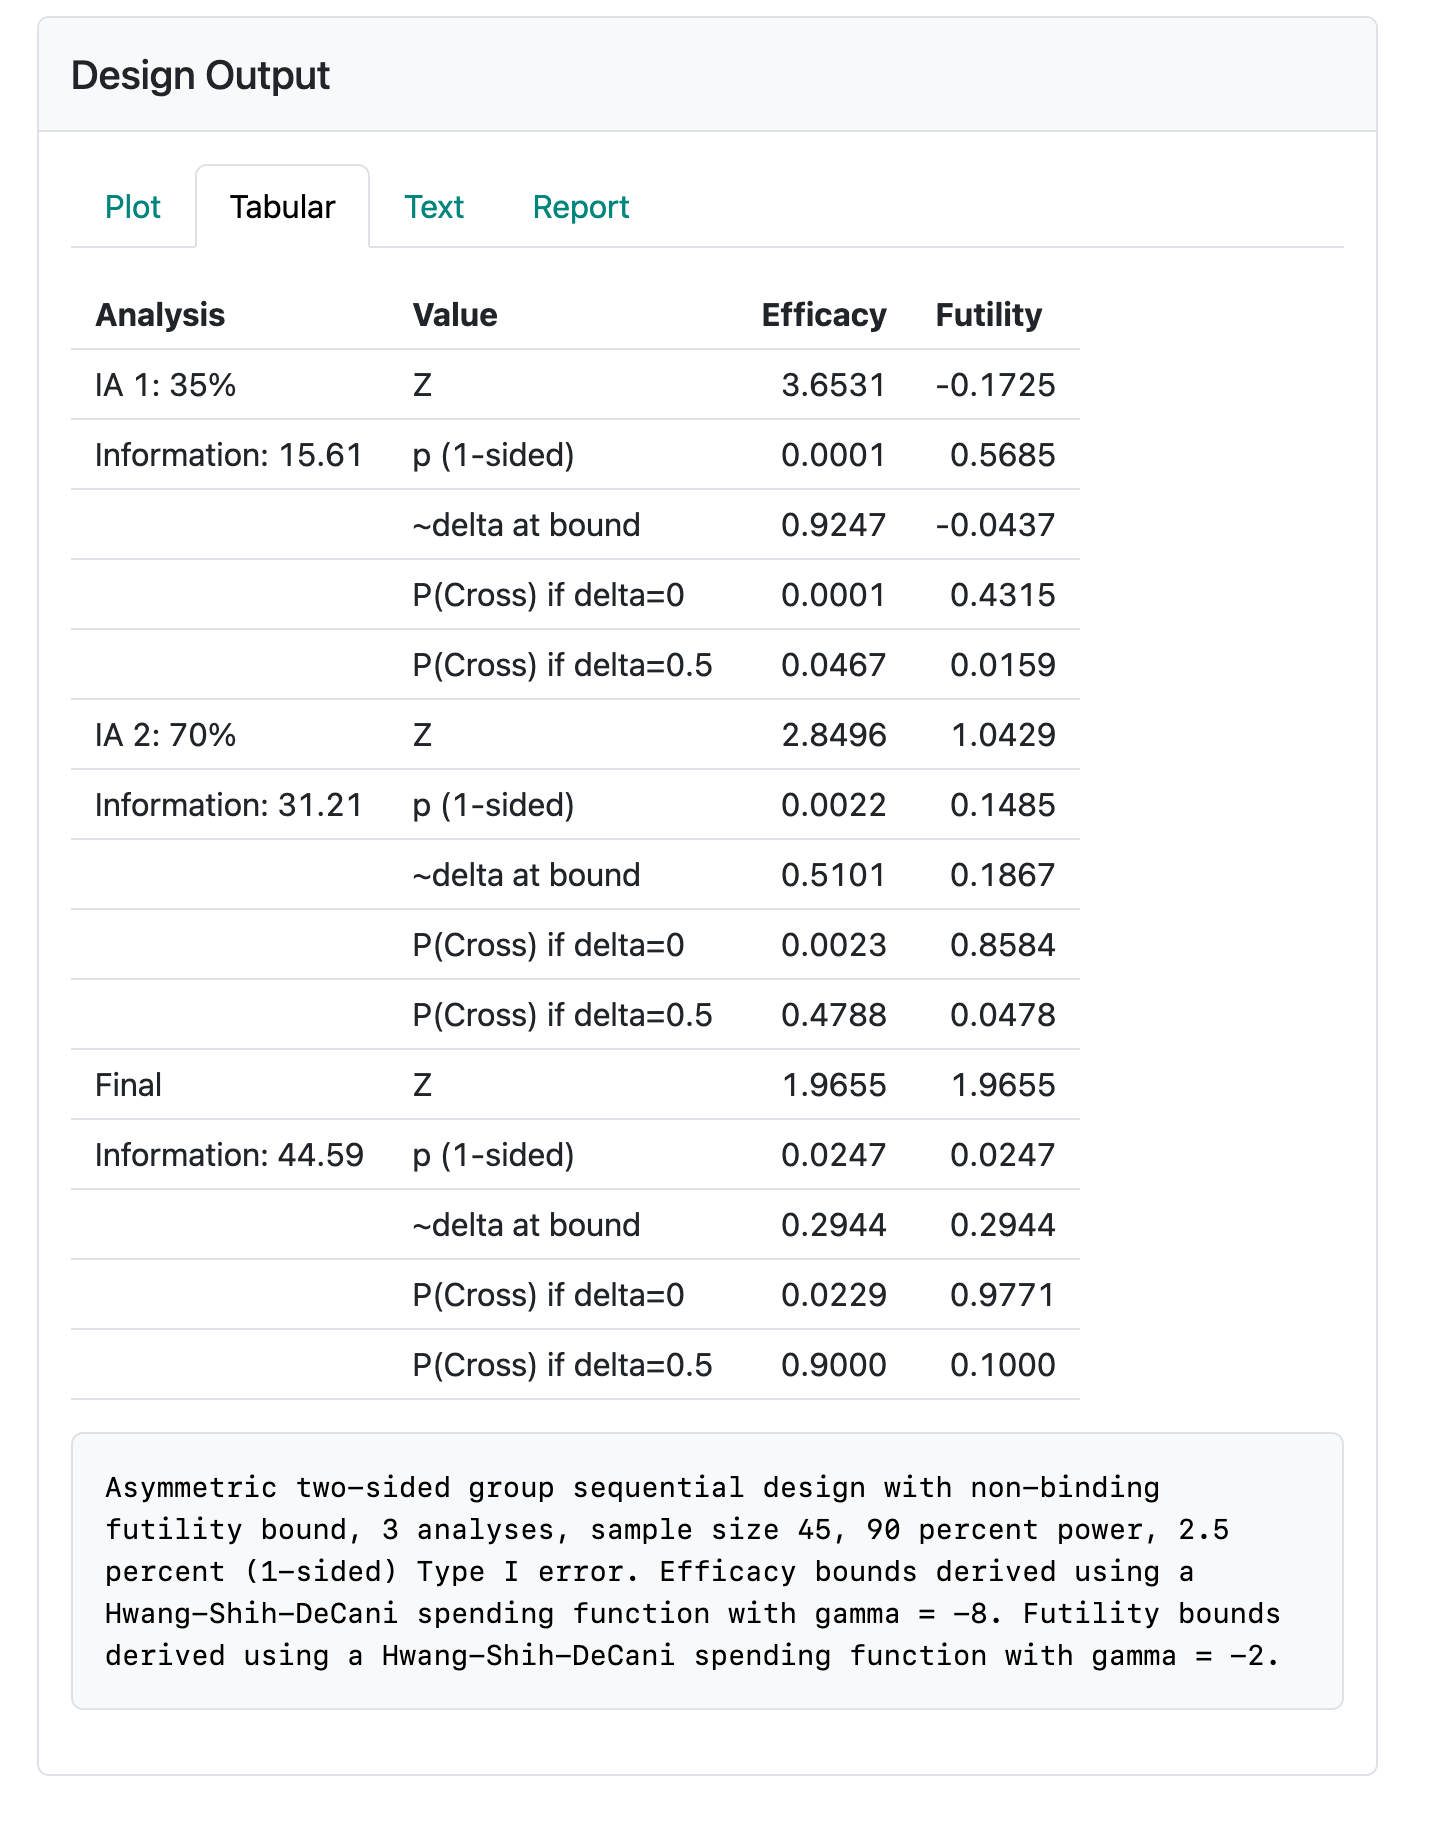
Tabular output looks very much as before. In fact, in the present version of the software, the caption (text summary) for the tabular output looks too much like other cases in that “sample size” has not been replaced with “Statistical information” (Figure 6.5).
6.2.3 Applying an information-based design
Now we give an example of how to apply an information-based design. This will be further developed in Chapter 9 where we introduce R coding for the R package gsDesign. Recall that the statistical information is indicated by \(n / \psi\) where \(\psi / n\) is the variance of the estimate we are using for treatment effect. Suppose after 200 patients, we estimate \(\psi\) to be 20. Then we would estimate 300 patients would be needed to get information of \(n / \psi = 15\), the amount of information required for the first analysis in the design. Normally, the estimate of \(\psi\) will stabilize in a reasonable time frame and this method can be used for adapting sample size when variation is not well-understood.
The screen for updating an information-based design is shown in Figure 6.6.
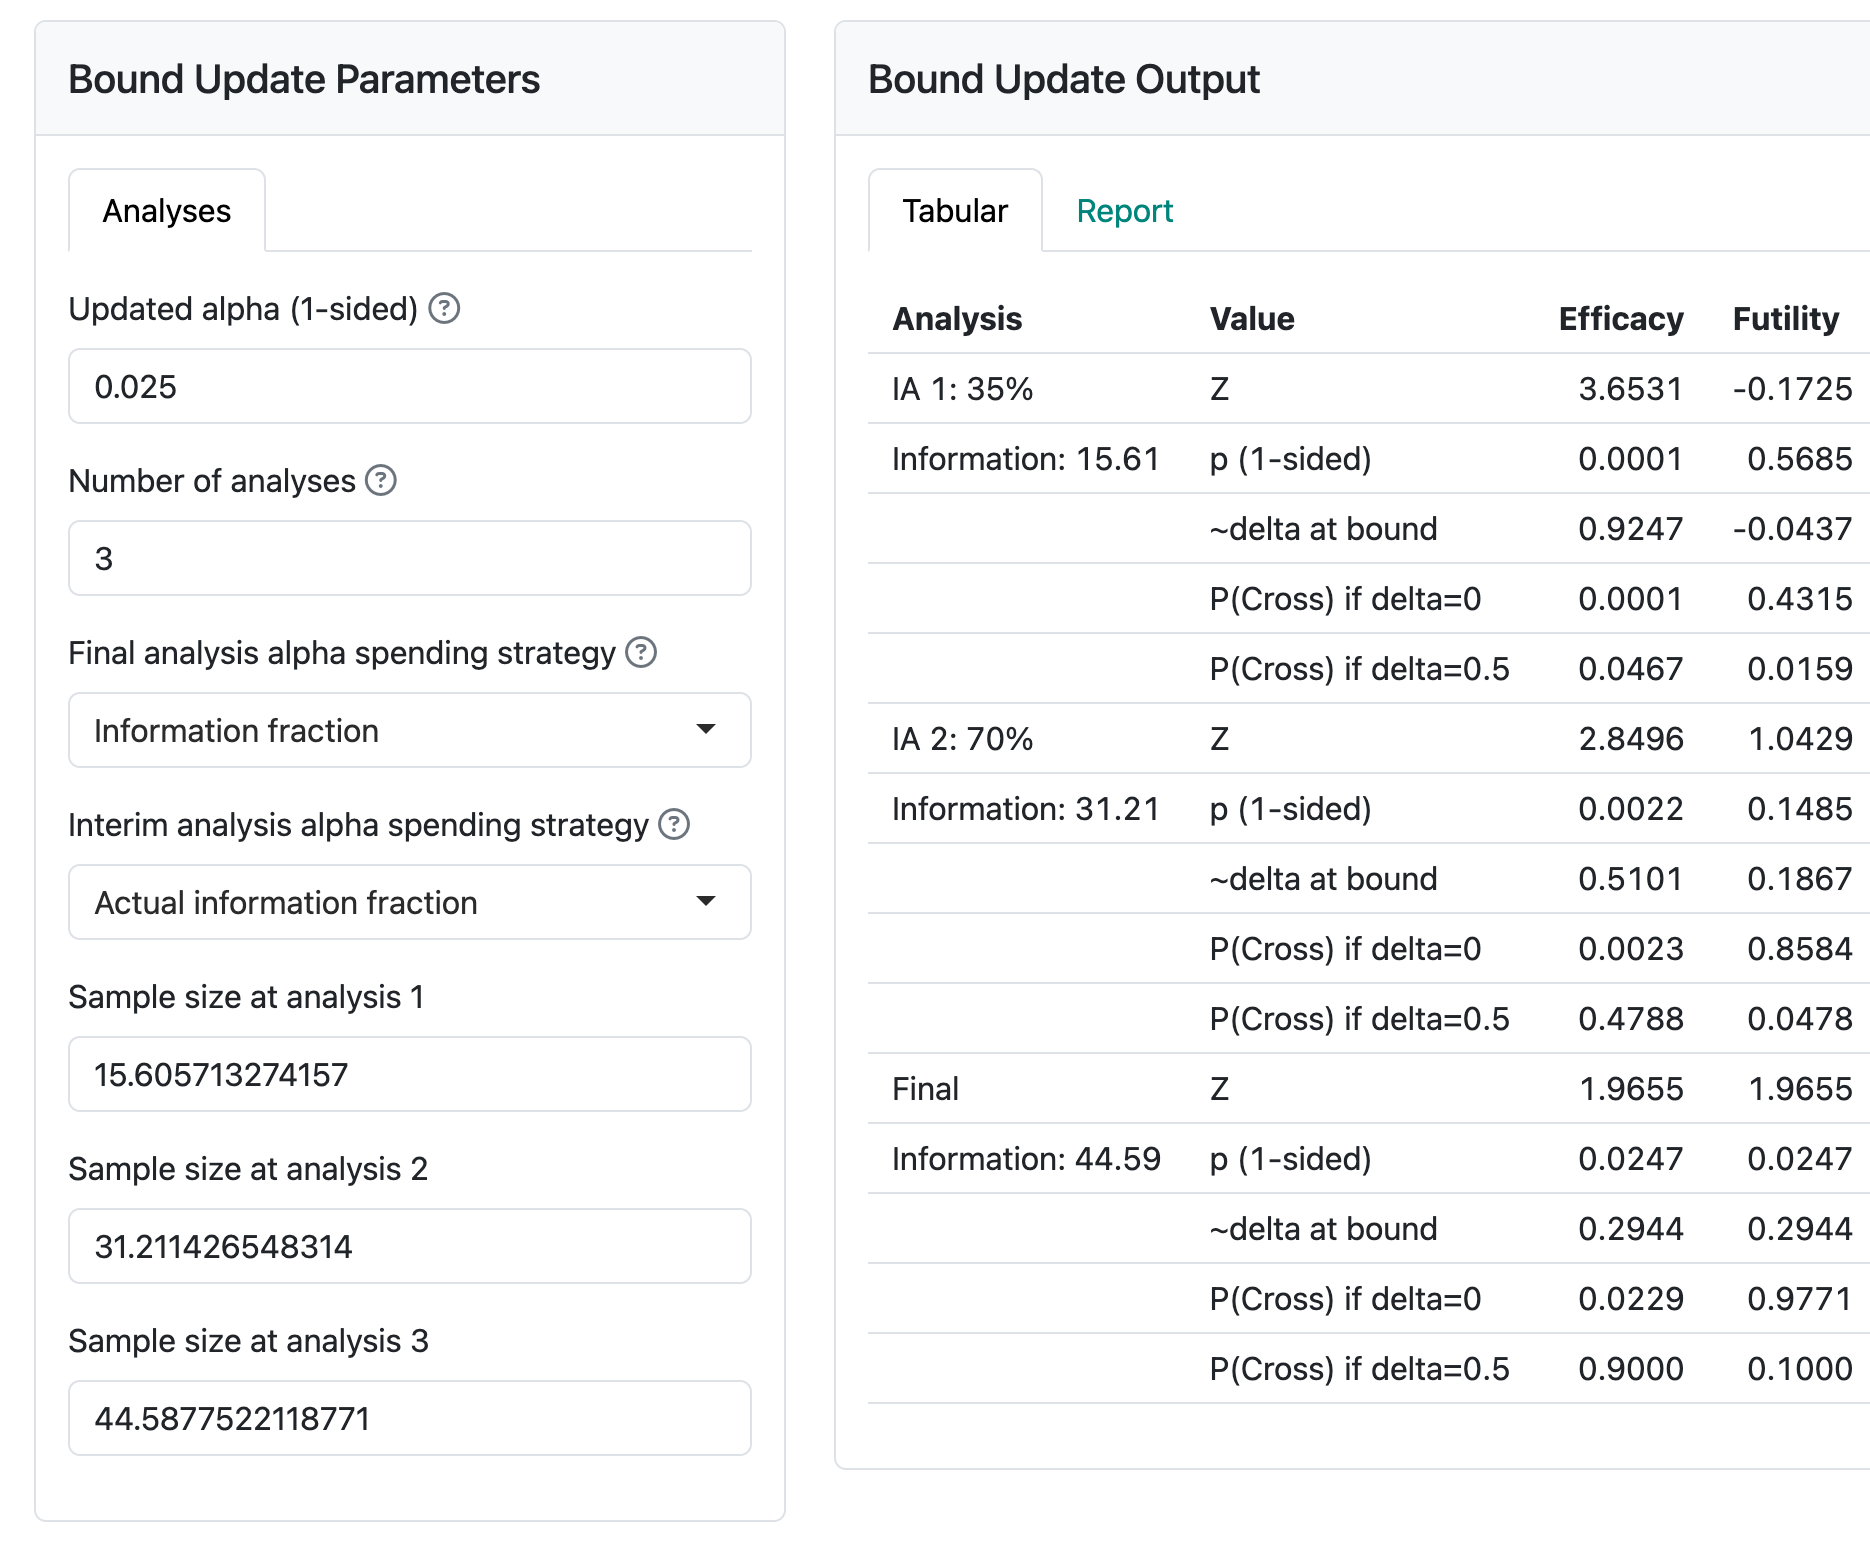
After computing statistical information at a given analysis, this is entered in the input panel for each analysis as it arrives. At that time, you can also update anticipated statistical information for other analyses, if desired.